ATB Experiment 1 - Cycling of energy input.
This experiment is being conducted to examine the conjecture that
living systems differ from inanimate systems, such as fire, in that
they maximize entropy production averaged over a characteristic time
scale appropriate to the system based on perturbations the system has
evolved to cope with. The ability of living systems to average
entropy production over time results from their ability to predict
future states based on information (in a Shannon context) that is
stored in their genome and acquired (learned) via Darwinian evolution and culled by natural selection.
Simply stated, Free
energy spawns the creation of information that hastens free energy’s
destruction.
In this experiment, two replicate methanotrophic microcosms
(MCs) are continuously sparged with methane plus air, while two
other replicate MCs are periodically sparged between methane +
air
and just
air. The initial cycle period was 20 days (10 days with CH4
+ air and 10 days with just air), was reduced to 4 days, and is currently
not being cycled. Hypothesis:
The microbial communities will adapt (and evolve) to the periodic
energy input such that internal entropy production in cycled MCs will
match that in MCs with continuous energy input when integrated over the
cycle period. The major uncertainly and caveat is, how
long will it take for the systems to adapt?
Note,
current MEP model for the MCs indicates that the cycle treatements are
functioning at a MEP state; however, the communitiy cannot allocate
metabolic machinery fast enough to perform as well as the control MCs.
See: Vallino, J.J., Algar, C.K., Fernandez Gonzalez, N., Huber,
J.A.. (2014) Use of receding horizon optimal control to solve
MaxEP-based biogeochemistry problems. In Beyond the Second Law: Entropy
Production and Non-Equilibrium Systems, Dewar, R.C.,
Lineweaver, C., Niven, R. and Regenauer-Lieb, K., (eds),
Springer, pp 337-359, doi: 10.1007/978-3-642-40154-1_18. (draft version)
Some near real-time gas data from the MCs are
given below and electrode data on other pages (see menu bar). These
images will be updated every 5 hours (you
may
need to refresh your browser window to see latest data). Time
zero of this experiment corresponds to 0:00 20 Aug 2010. Energy cycling
began on day 210.5 (18 Mar 2011); on 12 Jan 2014, the cycling has been
temporarily stopped.
***
As of 23 Jan 2015 11:11 the sampling of the microcosms as ended and
will be taken down shortly. Data will be posted shortly.
Carbon Dioxide Data (last 40 days):
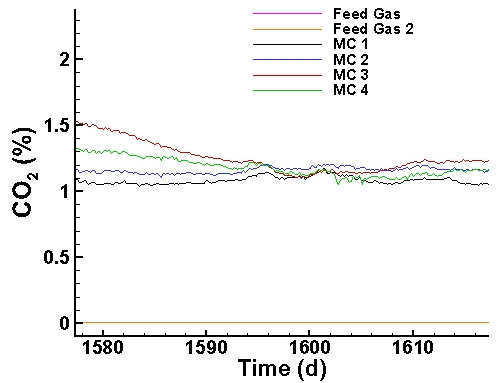
Methane Data (last 40 days):
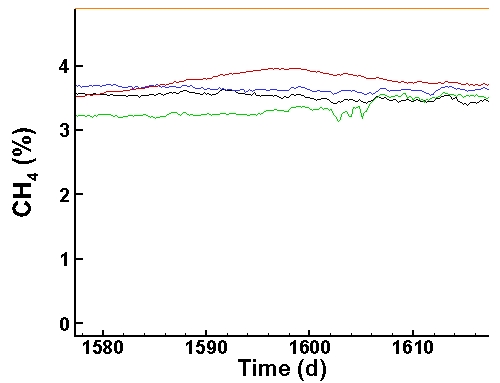
Oxygen Data (last 40 days):
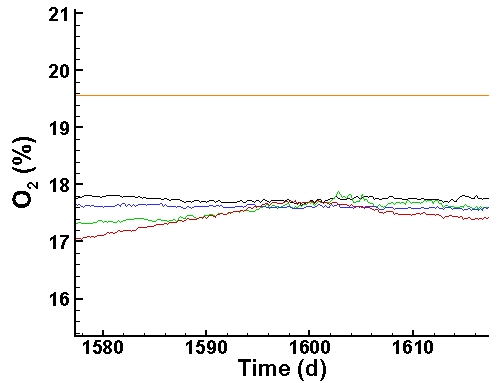
Instrument Deviation Corrections (last 40 days):
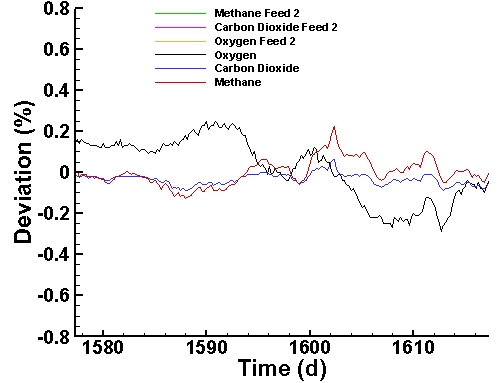
Electrode data (pH, DO and ORP)
are here.
Experimental Events:
- Experiment Begun (t = 0 set at 00:00:00 20 Aug 2010)
- Microcosms (MCs) cross inoculated (t = 3.8 d).
- Media added to attain 18 L volume (t = 4.8 d).
- New pH and DO probes installed (t=13.8 d)
- Porous ceramic gas diffusers
installed (t=20.8 d)
- Reversed rotation of impellers, same speed: 10 RPM (t=27.5
d)
- Chemostat hardware installed, and MCs setup to operate as
"circle-o-stats"; MC 1 -> MC 2 -> MC 3 ->MC 4
-> MC
1. Flow rate is set at 10 mL/min. This will allow cross
mixing all of MCs (20:00 21 Sep 10; t = 32.8 d)
- High flow ceramic gas diffusers installed, and ORP probes
cleaned
(18:00 14 Oct 10, t=55.7 d).
- Normal chemostat operation started with D = 0.1 d-1,
or 1.25 mL min-1 (17:40 21 Oct 10, t=62.7 d).
Medium
composition: 700 μM KNO3, 70 μM KH2PO4,
100 μM MgSO4, 100 μM CaCl2,
100 μM NaCl, plus
trace element solution.
- UPS failure, system and gas flow shut down for ~ 24 hrs
(11:00 24
Oct 10, t=65.45 d).
- DO probes repaired and installed. Biomas/detritus
clumps
around probes and sample tubes broken up by general mixing of
MCs. ORP probes cleaned and pH probes calibrated. (12:00 12
Nov
10, t=84.5 d).
- System returned to "circle-o-stat" mode (see event 7.
above),
with a flow rate of 20 mL/min. Feed of medium temporarily turned off.
(13:06 21 Dec 2010, t = 123.5 d)
- Resuspended particulat matter and cleaned ceramic gas
diffusers.
(15:00 23 Dec 2010, t = 125.6 d)
- Returned to chemostat mode with D = 0.05 d-1,
or 0.60 mL min-1 (19:15 30 Dec 2010, t = 132.8
d).
- Cleaned ceramic diffusers. (17:40 6 Jan 2011, t = 139.7 d)
- Chemostat flow rate increased to D = 0.1 d-1,
or 1.25 mL min-1 (15:40 7 Jan 2011, t = 140.7 d)
- Cleaned ceramic diffusers. (16:40 13 Jan 2011, t = 146.7 d)
- Cleaned ceramic diffusers. (16:30 25 Jan 2011, t = 158.7 d)
- Concentration of KNO3 reduced from
700 to 400
μM. See event 9 above. (17:45 26 Jan 2011, t =
159.7
d)
- Cleaned diffusers and electrodes. (17:30 3 Feb 2011, t =
167.7 d)
- Concentration of KNO3 reduced from
400 to 100
μM. See event 9 above. (10:30 6 Feb 2011, t = 170.4
d)
- Cleaned gas diffusers and electrodes. (17:30 17
Feb 2011, t = 181.7 d)
- Concentration of KNO3 reduced from
100 to 50
μM. See events 9 and 21 above. (15:00 18 Feb 2011,
t = 182.6
d)
- Cleaned gas diffusers and cleaned and calibrated
electrodes. (17:30 4 Mar 2011, t = 196.7 d)
- Feed turned off for 2 days starting at 7:00 12 Mar 2011 (t
= 204.3 d).
- Gas cycling
started for MCs 1 and 4.
Air only will be on for 10 days followed by air + methane for 10 days.
This cycling (20 day period) to MCs 1 and 4 only will
continue
automatically until stopped. (11:45 18 Mar 2011, t =
210.49 d)
- Calibrated and cleaned DO and pH probes, cleaned ORP
probes. (17:00 5 Apr 2011, t = 228.71 d)
- Calibrated DO, pH, pumps, and gas analyzers (17:00
3 May 2011, t = 256.7 d)
- 900 μmoles of KNO3 were added to all
MCs (50 μM MC concentration) to confirm for NO3-
limitation (14:45 13 May 2011, t = 266.61 d).
- Phosphate buffer (10 mM, pH 6.8) was added to all MCs
because low pH may be limiting metabolism based on 13 May KNO3
spike response (14:30 19 May 2011, t = 272.60 d).
- Currently
microcosms are being sampled every 10 days for nutrients, DNA/RNA, and
cell counts (viruses, prokaryotes and eukaryotes), which induces the
small spike in gas concentration data (25 Aug 2011, t = 370.00 d).
- DO and pH probes recalibrated (17:00 21 Oct 2011, t =
427.71 d)
- DO probes reconditioned, pH probes and chemostat pumps
calibrated (16:00 10 Jan 2012, t = 508.67 d)
- Gas cycling
reduced to a 4 day period, 2 days on, 2 days off (15:35 11
Jan 2012, t = 509.65 d)
- Computer
failure 4:00 10 Mar 2012 (t = 568.17 d). System maintained in CH4+Air
mode. Hardware fixed 9:00 13 Mar 2012 (t = 571.38 d).
One
CH4 off cycle missed.
- Nine
samples being taken over the course of a single methane cycle period
(started 6 Aug 2012 13:30, t = 717.56 d, ending 10 Aug 2012 13:30, t =
721.56 d).
- Methane
cycling on MC's 1 and 4 has been stopped, and they have
been returned
to continuous methane + air input (12 Jan 2014 15:30, t =1241.65 d).
- Drop in MC3 respiration due to biofilm development on ceramic gas diffuser, seen here. All diffusers were cleaned as well: 18 Jul 2014 (t = 1428.5 d)
- Bioreactors placed on batch model (media flow turned off) at 7 Aug 2014 11:00, t = 1448.5 d)
- Sampling of the bioreactors has stopped, and are being terminated (23 Jan 2015, t = 1617.47 d)
Experimental Equipment:
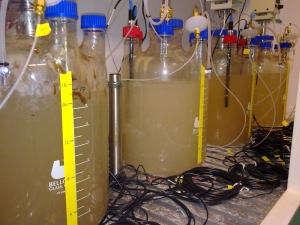
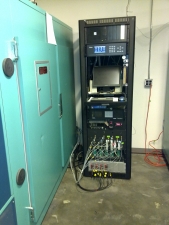
Image (left) shows the four Bellco
Glass
18 L methanotrophic microcosms on 24 Aug 2010 (t = 4.8 d), which have
been in continuous operation since 7 Oct 2005. Instrument rack and
environmental chamber housing the MCs (image on right) is equipped with
MKS mass flow controllers, CAI NDIR methane analyzer, Oxigraf O2 and CO2 laser diode absorption
spectrometer,
Consort
D230 data acquisition system for pH, DO and redox probes, Nafion drier and a computer for
monitoring and
experimental control via Valco selector valve, ASCO solenoid valves, Weeder
Technologies
WTDOT digital IO board and Comtrol RocketPort serial card.
Monitoring and
control software is written in Intel
Fortran (gigidy) and all com is via rs232.
Microcosms are sparged using porous ceramic gas diffusers
at 30 psig at a flow rate of 20 sccm controlled by MKS MFCs.
A
closed gas sampling loop regulated at a flow rate 240 mL/min by a Hargraves mini pump
(B.1F15E4.A12VDC) delivers reactor headspace gas to analyzers.
Source code for control and monitoring is given below, but the program
is not very user friendly, nor is there extensive documentation, but
they still may be of some use:
- MonitorGases
- Controls valves and logs gas analyzer data.
- MonitorMFC
- Can monitor and do some limited control of MKS 647c mass flow
programmer/display.
- julday
- used
by MonitorGases to convert date to elapsed days.
Graphics are generated by Tecplot


