On-Line Data from Experiment 1

First experiment.  Objectives of this experiment are to 1) tune operating conditions to achieve good growth of the algal culture, 2) examine how algal culture functions when connected to anaerobic digestor prior to inoculation with anaerobic community, 3) inoculate digestor with anaerobic community and monitor performance and 4) optimize operation of coupled system.

Experimental time started at 21 May 2015, 00:00

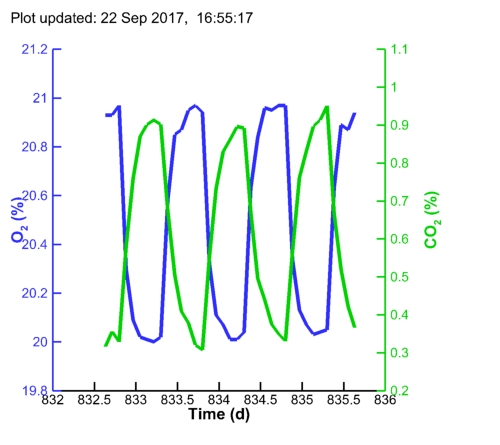
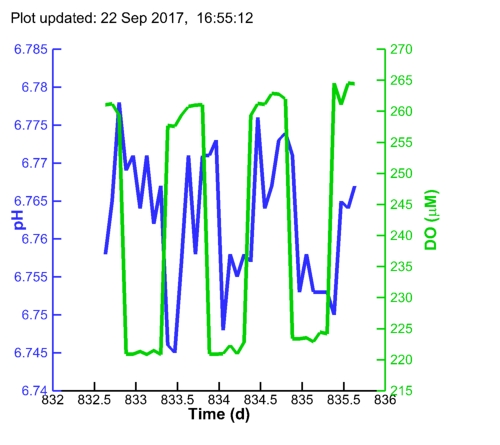
On-line variables associated with Algal Bioreactor (last 36 points):

Gas concentrations in outputDissolve oxygen and pH in Algal bioreactor
Plot of O2, CO2 and CH4 over all time.  Plot of pH and DO over all time.  Interactive graphics are also available under the JavaScript Graphics menu item above.

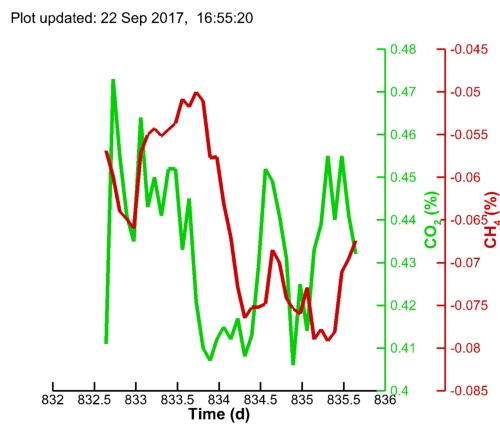
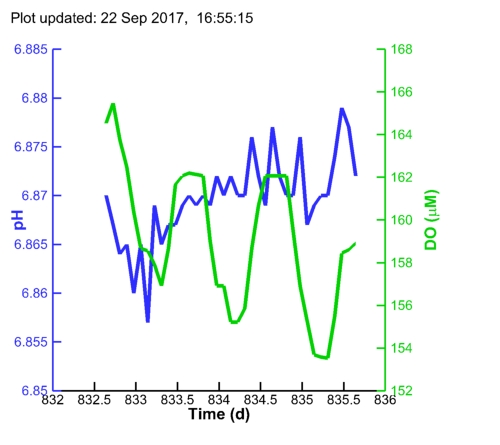
On-line variables associated with Methanogenic Bioreactor (Last 36 points):

Concentration of off gases in digestorDO and pH associated with digestor
Plot of O2, CO2 and CH4 over all time.  Plot of pH and DO over all time.  Interactive graphics are also available under the JavaScript Graphics menu item above.

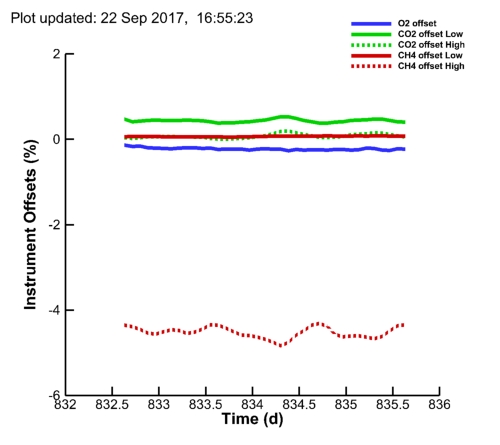
Instrument Drift (between analyzer calibrations), Last 36 points

Instrument Drift
Instrument Drift over all time.

Experimental Events:

  1. Experiment begun.  Filter sterilized medium added to reactors and monitoring program and analyzers started (19:13 21 May 2015)
  2. Algal bioreactor inoculated with 1 L of Chlamydomonas reinhartii CW15 mutant lacking cell wall (12:30 22 May 2013).  Note, 18 L digestor has not been inoculated and flow between reactors has been stopped to allow algae to grow.
  3. Gas flow rate of air increased from 20 to 50 mL/min due to decreasing DO concentration in algal bioreactor (21:35 24 May 2015)
  4. Gas flow rate of air increased from 50 to 100 mL/min due to decreasing DO concentration in algal bioreactor (9:00 25 May 2015).  Neither increase in flow help situation very much.  
  5. Removed shade screen from algal culture. This reversed the declining DO and net heterotrophy (12:00 25 May 2015)
  6. Returned air flow to algal reactor to 20 mL/min (10:20 26 May 2015).
  7. Decreased sample interval from every 5 hr to every 2 hr. (22:40 26 May 2015, t = 5.94 d)
  8. Time on growth chamber was ~ 4 hrs slow.  It has been updated to correct EDT (14:10 27 May 2015, t = 6.59 d)
  9. Impeller speed for algal reactor increased to 60 RPM (12:41 28 May 2015, t = 7.53 d)
  10. Decrease air flow to algal reactor to 5 mL/min (18:10 28 May 2015, t = 7.76 d)
  11. Currently, algal reactor is becoming CO2 limited very quickly after lights turn on.  Gas diffusers will be installed soon to improve gas-liquid transfer characteristics.
  12. Reduce N2 flow rate to digestor to 5 mL/min (16:10 10 Jun 2015, t = 20.67 d)
  13. Installed gas diffusers on algal and methanogenic reactors (2 µm) and increased gas flow in algal reactor to 20 mL/min (11:07 20 Jun 2015, t = 40.46 d).
  14. Decreased gas flow in algal reactor to 5 mL/min (17:41 8 Jul 2015, t = 48.37 d)
  15. Increase light level in growth chamber to 2 metal halides plus 2 HP sodium lamps (17:13 10 Jul 2015, t = 50.72 d)
  16. Increase gas flow in algal reactor to 20 mL/min (14:05 14 Jul 2015, t = 54.59 d)
  17. Added CO2 to air stream to bring CO2 partial pressure to 2% from ambient air (~0.03%) (11:40 16 Jul 2015, t = 56.58 d).
  18. External calibration of gas analyzers (13:15 17 Jul 2015, t = 57.55 d)
  19. CO2 in air to algal culture has been turned off due to pH crash (9:12 19 Jul 2015, t = 59.39 d)
  20. Approximately 10 mL of a 4 M K2HPO4 solution was added to algal reactor increasing the PO4 concentration by 10 mM. pH increased rapidly to ~7.45 (13:15 20 Jul 2015, t = 60.55 d)
  21. CO2 enrichment (2%) restored to algal reactor.  pH (currently at 7.45) will be monitored and adjusted with K2HPO4 as needed. (15:07 20 Jul 2015, t = 60.63 d)
  22. Potassium phosphate buffer (10 mM) adjusted to pH 7.5 was added to the digestor (17:49 22 Jul 2015, t = 62.74 d).
  23. Coupled chemostat flow between reactors was turned on at an effective dilution rate of 0.1 d-1 based on algal reactor volume (17:50 22 Jul 2015, t = 62.74 d).
  24. Increased exchange flow between reactors to 1.0 d-1, or 4.032 L d-1.  Also increased N2 gas flow to digestor from 5 to 20 mL min-1 (9:17 23 Jul 2015, t = 63.39 d)
  25. Methanogenic reactor (aka digestor) was inoculated with ~500 mL of an anaerobic groundwater sample collected from a 6 m deep well located near the inlet of Little Pond, Falmouth (well LP7: 41.558512º Lat, -70.591887º Long).  Sample measurements: DO, 0 mg/L; pH 5.75; Salinity 0.2 ppt; Temp, 13.9ºC (19:11 30 Jul 2015, t = 70.80 d).
  26. Monitoring computer locked up for ~ 9 hr. (starting at 10:42  to 19:42 1 Aug 2015, t = 72.40 - 72.82 d).
  27. External calibration of gas analyzers conducted (11:31 4 Aug 2015, t = 75.48 d)
  28. Flow between bioreactors stopped to facilitate assessment of respiration in digestor (12:30 10 Aug 2015, t = 81.54 d)
  29. Added 10 mL of 4 M K2HPO4 solution to algal reactor only (11:38 14 Aug 2015, t = 85.48 d)
  30. Approximately 0.4 mL of anaerobic sediments collected from station P22 along the Parker River was added to digestor to augment inoculum (15:31 21 Aug 2015, t = 92.65 d)
  31. Around 10:20 on 25 Aug 2015 (t = 96.4 d), the CO2 gas cylinder went empty, so CO2 algal feed concentration returned to atmospheric levels (~0.03%).
  32. Enrichment of CO2 to algal feed gas returned to 2% (10:52 28 Aug 2015, t = 99.45 d).
  33. Approximately 0.5 L of medium from digestor was transfered to algal reactor to makeup for samples that have been withdrawn for algal reactor (15:30 28 Aug 2015, t = 99.65 d).
  34. Increased N2 flow rate to digestor from 20 to 30 mL min-1 (14:48 1 Sep 2015, t = 103.62 d).
  35. Approximately 100 mL of suspended sediments (i.e., microbial aggregations or flocs) from the sequence batch reactor at the Falmouth Wastewater treatment plant was added to the digestor to augment inoculum (13:13 3 Sep 2015, t = 105.55 d)
  36. Added 2.45 g of sodium acetate trihydrate to digestor to stimulate methanogens.  Concentration increased by approximately 1 mM (16:04 9 Sep 2015, t = 111.67 d).
  37. Added 3.24 g of D-glucose to digestor.  Concentration increased by approximately 1 mM (9:34 15 Sep 2015, t = 117.40 d).
  38. Upgraded MonitorA2M program and hardware for active control and monitoring of CO2 enrichment of air feed to algal reactor (17:39 22 Sep 2015, t = 124.74 d)
  39. Returned to coupling algal and methanogenic reactors at a dilution rate of 1 d-1 with respect to algal reactor volume (exchange flow at 4 L d-1) (10:11 23 Sep 2015, t = 125.42 d)
  40. Increased air+CO2 gas flow to algal reactor to 30 mL min-1 (16:20 23-Sep-2015, t = 125.68 d)
  41. Increased air+CO2 gas flow to algal reactor to 100 mL min-1. DO in algal reactor near zero, likely because of carry over of glucose and acetate from digestor that was previously added (notes 36 and 37 above). (21:55 25-Sep-2015, t = 127.91 d)
  42. Exchange flow between algal and methanogenic reactors temporarily stopped (14:33 26-Sep-2015, t = 128.62 d)
  43. Returned algal reactor gas flow rate to 30 mL min-1 (9:46 30-Sep-2015, t = 132.41 d)
  44. Returning to 100 mL min-1 in algal reactor due to continued high respiration rate (12:19 30-Sep-2015, t = 132.51 d)
  45. Returned algal reactor gas flow rate to 30 mL min-1 since system is nearing net autotrophy (9:30 6-Oct-2015, t = 138.40 d)
  46. Added hardware and modified MonitorA2M program for computer control of exchange pump. Also added two point calibration for CO2 analyzer to improve CO2 readings in digestor. This resulting in  format change for the Exp1.dat file (new column) (17:20 6-Oct-2015, t = 138.72 d)
  47. Impeller direction reversed in Algal reactor, but speed still at 60 RPM (9:20 9-Oct-2015, t = 141.39 d)
  48. Calculations indicate that all of the added glucose and acetate have been consumed (see Mathematica file below), and there has been a turn down in CH4 production.  Consequently, the algal and methanogenic reactors have been recoupled at a flow rate of 0.4 L d-1, or a dilution rate of 0.1 d-1 (10:20 18-Oct-2015, t = 150.43 d).
  49. Reduced exchange flow rate to 0.05 d-1 (0.20 L d-1) to reduce low DO in algal reactor (9:39 23-Oct-2015, t = 155.40 d).
  50. Reduced exchange flow rate to 0.01 d-1 (0.04 L d-1) to reduce low DO in algal reactor (21:32 27-Oct-2015, t = 159.90 d).
  51. Increased air+CO2 gas flow to algal reactor to 100 mL min-1. DO in algal reactor near zero (10:25 29-Oct-2015, t = 161.43 d).
  52. Flow between reactors stopped (21:38 7-Nov-2015, t = 170.90 d).
  53. Several changes made (11:35 10-Nov-2015, t = 173.45 d)
    1. Decreased Air+CO2 gas flow to algal reactor to 30 mL min-1
    2. Changed direction of agitation in algal reactor
    3. Added 10 mL of 4 M K2HPO4 to increase pH to 7.0
  54. Returned Air+CO2 gas flow to algal reactor to 100 mL min-1 (21:35 10-Nov-2015, t = 173.90 d)
  55. Reduced Air+CO2 gas flow to algal reactor to 30 mL min-1 due to low tank pressure (11:09 12-Nov-2015, t = 175.46 d)
  56. Returned Air+CO2 gas flow to algal reactor to 100 mL min-1 with new air tank (10:51 13-Nov-2015, t = 176.45 d)
  57. Reduced Air+CO2 gas flow to algal reactor to 30 mL min-1 due to lower metabolic rates (16:00 4-Dec-2015, t = 197.67 d)
  58. 500 mL of TAP media was added to both reactors (12:30 9-Dec-2015, t = 202.52 d)
  59. 4.5 g of FeCl3 as added to digestor to simulate methanogenesis (10:58 11-Dec-2015, t = 204.46 d)
  60. Reduced N2 gas flow to digestor from 30 to 5 mL min-1 to see if CH4 production can be detected (16:51 15-Dec-2015, t = 208.70 d)
  61. Changed A2M monitoring program to increase input gas flow to reactors during gas sampling to prevent intrusion of air if nominal flow rate is low (below 30 mL/min) (15:27 23-Dec-2015, t = 208.70 d)
  62. New air tank on line and gas analyzers calibrated (17:22 15-Jan-2016, t = 239.7 d)
  63. Exchange flow between digestor and algal reactor reestablished at a dilution rate of 0.05 d-1 or 0.2 L d-1 (10:44 19-Jan-2016, t = 243.45 d)
  64. Flow between reactors turned off (12:17 29-Jan-2016, t = 253.51)
  65. In-line UV sterilizers installed on both flows connecting the reactors, flow between the reactors returned to 0.05 d-1 or 0.2 L d-1 and approximately 600 mL of fresh medium was added to the system (18:41 22-Feb-2016, t = 277.78 d)
  66. Reactor exchange flow rate increased to 0.4 L d-1, or 0.1 d-1 (10:23 3-Mar-2016, t = 287.43 d)
  67. New air tank on-line and calibrated gas analyzers (10:33 5-Apr-206, t = 320.44 d)
  68. Increase exchange flow between reactors to to 0.8 L d-1, or 0.2 d-1 (11:45 5-Apr-2016, t = 320.49 d)
  69. Several modifications were made (11:52 29 Apr 2016, t = 344.49 d)
  70. Increased exchange flow between reactors to 1.0 L d-1 or 0.25 d-1 (10:31 3-May-2016, t = 348.44 d)
  71. Increased exchange flow between reactors to 2.0 L d-1 or 0.5 d-1 (15:21 6-May-2016, t = 351.64 d)
  72. Increased exchange flow between reactors to 4.0 L d-1 or 1.0 d-1 (10:50 9-May-2016, t = 354.45 d)
  73. Added 7 mL of 4 M K2HPO4 to increase pH in Algal reactor (10:11 12-May-2016, t = 357.42 d)
  74. Added 30 mL of 4 M K2HPO4 to increase pH in Algal reactor (18:25 18-May-2016, t = 363.77 d)
  75. Increased aggitation in digestor from 10 to 30 RPM (9:44 19-May-2016, t = 364.41 d)
  76. Added 90 mL of 4 M K2HPO4 to increase pH in Algal reactor (9:38 31-May-2016, t = 376.40 d)
  77. At approximatly 2:00 3-Jun-2016 (379.1 d), the pressure in the N2 gas cylinder went to 0 psig.  This was not corrected until 9:52 3-Jun-2016 (379.41 d).  The lack of N2 gas flow allowed some air to enter the digestor and corrupted the methane analyzer high calibration. 
  78. Nitrogen tanked emptied approximately 22:48 26-Jun-2016 (t = 402.94 d) and was not corrected until 10:20 27-Jun-2016 (t = 403.43 d).
  79. New air tank on-line and gas instruments calibrated (11:15 28-Jun-2016, t = 404.47 d)
  80. Two UV sterilizers were placed within cell disruptor loop feeding algae to digestor (see here).  Loop volume approximately 600 mL (18:00 30-Jun-2016, t = 406.75 d)
  81. Increased exchange flow between reactors to 6.0 L d-1 or 1.5 d-1 (14:57 15-Jul-2016, t = 421.62 d)
  82. Increased exchange flow between reactors to 8.0 L d-1 or 2.0 d-1 (9:51 28-Jul-2016, t = 434.41 d)
  83. Returned flow between reactors to 6.0 L d-1 or 1.5 d-1.  Dilution rate of digestor at 8 L d-1 is 0.44 d-1, which is around maximum growth rate of methanogenes (see here), so washout may be occuring (14:57 30-Jul-2016, t = 436.38 d).
  84. Reduced flow between reactors to 4.0 L d-1 or 1.0 d-1 (14:08 18-Aug-2016, t = 455.59 d).  
  85. Replaced air tank and calibrated gas analyzers (13:43 16-Sep-2016, t = 484.57 d).
  86. Reduced flow between reactors to 2.0 L d-1 or 0.5 d-1 (16:54 19-Sep-2016, t = 487.70 d).
  87. Failure of UV circulation loop resulted in a loss of approximately 4 L of medium from the algal reactor some time around 21-Sep-2016, which was not noticed until 8:19 22-Sep-2016, t = 490.35 d.  UV loop was repaired and 4 L of fresh TAP media was added to the system and exchange pump returned to  previous flow rate of 2.0 L d-1 or 0.5 d-1 (17:16 22-Sep-2016, t = 490.72 d).
  88. An additional 500 mL of TAP medium was added to algal reactor (9:50 23-Sep-2016, t = 491.41 d).
  89. Increase flow between reactors to 6.0 L d-1 or 1.5 d-1(15:49 21-Oct-2016, t = 519.66 d)
  90. Gas flow to reactors turned off for ~1.5 hr while reactors were moved in growth chamber (15:00 15-Nov-2016, t = 544.62 d)
  91. Flow between reactors was blocked for about two days (starting 13:00 15-Nov-2016) until now. Flow has been reestablished (10:30 17-Nov-2016, t =  546.44 d)
  92. Modifications to this experiment are still occuring, but are now documented in the file Exp1.info
  93. Monitoring program temporarily stopped while the methane analyzer is sent out for repairs. (16:30 9-May-2017, t = 719.69 d)

Data Files:

Primary gas and probe data: Exp1.dat
External variable values: Exp1.oc
Experimental info file: Exp1.info

Higher resolution (10 min) probe data from Hamilton's RS485 ModBus (updated here every 2 hr):
Algal pH: Trace_2015-07-10_17h17_pH_242122-2096.txt,
Trace_2015-07-24_10h01_pH_242122-2096.txt,
Trace_2015-08-01_19h41_pH_242122-2096.txt
Trace_2016-02-22_18h32_pH_242122-2096.txt
Trace_2016-04-29_13h02_pH_242122-2096.txt
Trace_2016-09-16_13h41_pH_242122-2096.txt
Algal DO: Trace_2015-07-10_17h17_DO_242453-02-210052.txt,
Trace_2015-07-24_10h02_DO_242453-02-210052.txt,
Trace_2015-08-01_19h42_DO_242453-02-210052.txt,
Trace_2016-02-22_18h32_DO_242453-02-210052.txt
Trace_2016-04-29_13h03_DO_242453-02-210052.txt
Trace_2016-09-16_13h41_DO_242453-02-210052.txt
Digestor pH: Trace_2015-07-10_17h17_pH_242122-2100.txt,
Trace_2015-07-24_10h02_pH_242122-2100.txt,
Trace_2015-08-01_19h42_pH_242122-2100.txt,
Trace_2016-02-22_18h32_pH_242122-2100.txt
Trace_2016-04-29_13h03_pH_242122-2100.txt
Trace_2016-09-16_13h41_pH_242122-2100.txt
Digestor DO: Trace_2015-07-10_17h17_DO_242453-02-210053.txt,
Trace_2015-07-24_10h02_DO_242453-02-210053.txt,
Trace_2015-08-01_19h42_DO_242453-02-210053.txt,
Trace_2016-02-22_18h32_DO_242453-02-210053.txt
Trace_2016-04-29_09h57_DO_242453-02-210053.txt
Trace_2016-09-16_13h41_DO_242453-02-210053.txt

Experimental Equipment:

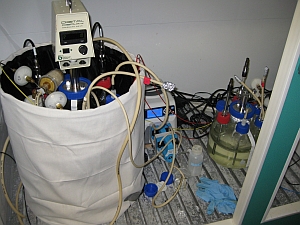
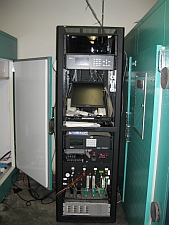
ReactorsInstruement Rack
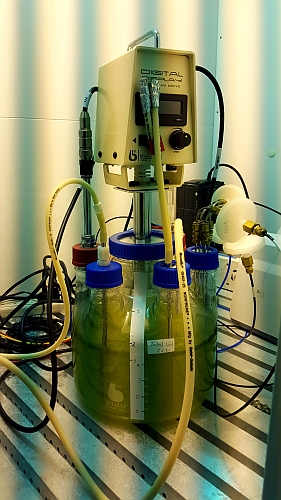
Image (left) shows the  Bellco Glass 18 L methanogenic and 3 L algal microcosms (MCs) on 22May 2015 just prior to start of Exp1. Instrument rack and environmental chamber housing the MCs (image on right) is equipped with MKS mass flow controllers, CAI NDIR methane analyzer, Oxigraf O2 and CO2 laser diode absorption spectrometer, Nafion drier and a computer for monitoring and experimental control via Valco selector valve, ASCO solenoid valves, Weeder Technologies WTDOT and WTAIN digital IO boards and Comtrol RocketPort serial card.  Monitoring and control software is written in Intel Fortran (gigidy) and all com is via rs232.

Reactor dissolved oxygen (DO) and pH are monitored with Hamilton VisiFerm DO Arc 335 and EasyFerm Plus Arc 325 probes, respectively.  Probes are controlled and calibrated via Hamilton Device Manager software via a USB-ModBus RS 485 Converter.  Data from probes are logged from 4-20 mA signal outputs that are converted to 0-10 V with Wayjun Signal Isolators and digitized with a Weeder Tech WTAIN A2D board (data is also logged via ModBus at higher frequency). 

The algal microcosm is sparged with air and illuminated on a 12 hr diel cycle (6:00 on, 18:00 off), while the anaerobic digestor is sparged with N2 and placed in a dark enclosure within the Conviron PGR15 environmental chamber that is currently operated at 25 ºC.  Metal halide and high pressure sodium lamps provide illumination.  A closed gas sampling loop regulated at a flow rate of 240 mL/min by a Hargraves mini pump (B.1F15E4.A12VDC) delivers reactor headspace gas to analyzers.Sample loop has an approximate volume of 190 mL. A Masterflex L/S Digital drive connected to Easy-Load 3 peristaltic pump heads provides exchange flow between reactors.

Software

Program for monitoring instruments and control. Note, software makes use of Intel Visual Fortran's serial IO library:
Mathematica Files

Graphics are generated by Tecplot and HighCharts

Photos

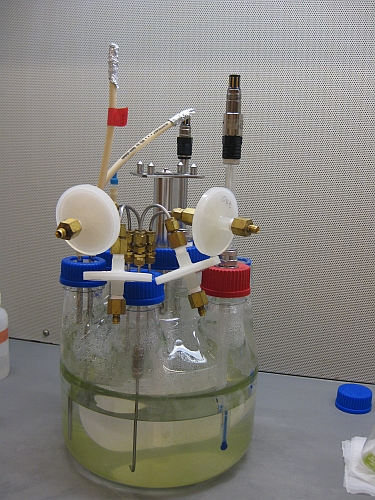
Algal reactor following inoculation (22 May 2015)
algal reactor

Algal reactor (5 Jun 2015 9:30, t = 15.38 d)
Algal reactor at day 15